Textual analysis of Facebook comments using Python
- What this is for: Collecting comments from a public Facebook page and performing a basic content analysis
- Requirements: Python Anaconda distribution, basic understanding of HTML structure and Chrome inspector tool
- Concepts covered: Social listening, word clouds
For anyone who works in strategic communications, it’s critical that you have a finger on the pulse of your community.
During the COVID-19 pandemic, this was more critical than ever. Rumors and misinformation swirled, and people were scared. To design messaging, you have to know what people are talking about.
Social media is a great place to find out what people are thinking, but there are some challenges with gathering your data here.
First, a lot of the conversation takes place on Facebook, and getting data from Facebook pages is not as easy as other platforms like Twitter.
While there are a wide range of social listening tools available, they come with costs and have limitations in getting data from Facebook. There are also ways to scrape Facebook, but this may not be a good idea.
So, basically I needed a quick and dirty way to comb the comments on a community Facebook page and store these comments into structured data format that we can then analyze.
In this tutorial, we’ll do just that.
I’ll be upfront – there are some downsides to this approach. It’s not real-time, so you’re essentially taking a “snapshot” in time. So this may work better for a qualitative research project as opposed to a crisis. There are some other downsides, which I’ll get to later.
However, this method is free and can be deployed fairly quickly without a need for advanced knowledge of web scraping. It can also capture all comments from a thread, not just queries that match specific keywords. So this may help in identifying other topics people are talking about that you may have missed.
Collecting comment data from Facebook
Another one of the downsides of this approach is there will be some manual work up front.
This method can only capture comments that are loaded to the DOM, so you will need to expand every “Reply” and every “See More” in the comment threads to extract the full text and reap the full benefit.
The good news is this is the hardest part, and once you do this, the rest is pretty smooth sailing.
Another downside is this only works well when you are interested in every recent post on the page. If the page is posting about a wide variety of topics, this will not work as well.
To start, go to the Facebook page you are looking to pull the data from (typically facebok.com/username/posts) in Chrome.
Underneath a post, find a comment and right click on the text. Select Inspect to open the Developer Tools.
Look for the class of the span that holds the text. Every comment should be wrapped in the same span class. In this case, it is “_3l3x”. You can do a spot check by inspecting other comments to ensure this is the case.

At this point, you can identify all the posts you want to gather comments on. Click to expand all of the replies or “see more” links for longer comments.
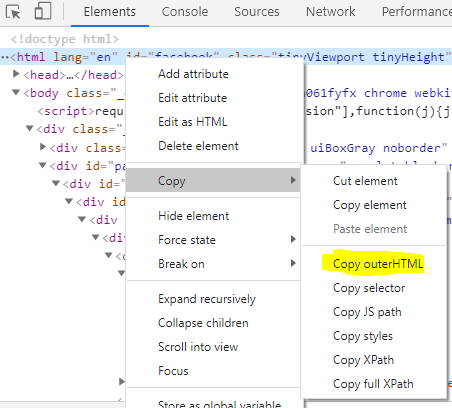
Once this is done, return to the Developer Tools and right click on the <html> tag. Select Copy -> Copy Outer HTML.

Open up the Notepad application and paste the content into a new file. Save as FB_data.html
Structuring the data into a dataframe
From here, we’ll be working in Python to extract all of the comment data into tabular format. Essentially, we’ll be using BeautifulSoup to extract the text from every span with the designated class.
First, we’ll import our libraries.
from bs4 import BeautifulSoup
import requests
import csv
import pandas as pd
Next, we’ll call on BeautifulSoup to read the file we just created.
url = 'FB_data.html'
page = open(url, encoding="utf8")
soup = BeautifulSoup(page.read())
Next, we’ll find every span that matches the class we found earlier. Then we’ll convert the extracted text into a list.
spans = soup.find_all('span', {'class' : '_3l3x'})
lines = [span.get_text() for span in spans]
Finally, we’ll create a dataframe from our new list
df = pd.DataFrame(lines,columns=['Comment'])
df
You may also want to perform some additional cleaning of the data, such as removing comments where a user was simply tagging another user. Using some string functions and filters, you could eliminate any comments that have 3 or fewer words.
Filtering your data
In the last step, we were able to take every Facebook comment from the page and organize them into a table.
In this step, we’ll create simple filters. Here’s where some knowledge about the topic comes into play. I knew there was a lot of discussion about COVID-19 testing, so I wanted to filter our data to show comments where users mentioned testing.
We can simply use the contains() function, passing the word “test” as a parameter. Let’s create a new dataframe called df_filtered:
df_filtered = df[df['Comment'].str.contains("test")]
df_filtered

You can of course create additional dataframes using the same approach, simply changing the parameter in the contains function.
If you need to export this to share with other team members, simply use the .to_csv() function.
df_filtered.to_csv('FB_comments_on_testing.csv')
Word Clouds & Common Phrases
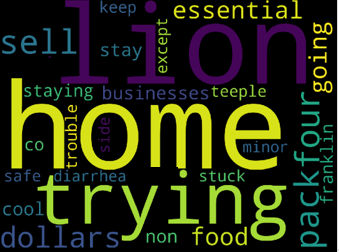
The final part will use textual analysis based on this analysis of Yelp reviews (which is based on another Github repo). Our goal is to create a word cloud showing the most common words in our Facebook data set, as well as a list of the most common 2- and 3-word phrases.
I won’t go into details here, but I encourage you to check out the link for a better explanation of the code and how it works.
import nltk
nltk.download('stopwords')
from textblob import TextBlob
from nltk.corpus import stopwords
from wordcloud import WordCloud
import seaborn as sns
import re, string
import sys
import time
import matplotlib.pyplot as plt
import collections

def tokenize(s):
    """Convert string to lowercase and split into words (ignoring
    punctuation), returning list of words.
    """
    word_list = re.findall(r'\w+', s.lower())
    filtered_words = [word for word in word_list if word not in stopwords.words('english')]
    return filtered_word

def count_ngrams(lines, min_length=2, max_length=4):
    """Iterate through given lines iterator (file object or list of
    lines) and return n-gram frequencies. The return value is a dict
    mapping the length of the n-gram to a collections.Counter
    object of n-gram tuple and number of times that n-gram occurred.
    Returned dict includes n-grams of length min_length to max_length.
    """
    lengths = range(min_length, max_length + 1)
    ngrams = {length: collections.Counter() for length in lengths}
    queue = collections.deque(maxlen=max_length)

    # Helper function to add n-grams at start of current queue to dict
    def add_queue():
        current = tuple(queue)
        for length in lengths:
            if len(current) >= length:
                ngrams[length][current[:length]] += 1

    # Loop through all lines and words and add n-grams to dict
    for line in lines:
        for word in tokenize(line):
            queue.append(word)
            if len(queue) >= max_length:
                add_queue()

    # Make sure we get the n-grams at the tail end of the queue
    while len(queue) > min_length:
        queue.popleft()
        add_queue()

    return ngrams
def print_most_frequent(ngrams, num=10):
    """Print num most common n-grams of each length in n-grams dict."""
    for n in sorted(ngrams):
        print('----- {} most common {}-word phrase -----'.format(num, n))
        for gram, count in ngrams[n].most_common(num):
            print('{0}: {1}'.format(' '.join(gram), count))
        print('')
def print_word_cloud(ngrams, num=5):
    """Print word cloud image plot """
    words = []
    for n in sorted(ngrams):
        for gram, count in ngrams[n].most_common(num):
            s = ' '.join(gram)
            words.append(s)

    cloud = WordCloud(width=1440, height= 1080,max_words= 200).generate(' '.join(words))
    plt.figure(figsize=(20, 15))
    plt.imshow(cloud)
    plt.axis('off');
    plt.show()
    print('')
Next, we’ll run our new functions to produce a word cloud
my_word_cloud = count_ngrams(df['Comment'],max_length=3)
print_word_cloud(my_word_cloud, 10)

Finally, we’ll run our last function to show the most common 2- and 3-word phrases that appear in our dataframe.
print_most_frequent(my_word_cloud, num= 10)

You could then use this data to go back to the filter step and create additional filters to query keywords or phrases.


