Working with weighted survey data in Power BI
If you’re working with weighted quantitative data, statistical software like SPSS (and its open source counterpart PSPP) have easy built-in functionality to handle the weights.
But it’s less straightforward if you’re working in other programs, so this quick tutorial shows how to complete basic calculations with weighted survey data in Power BI.
For this tutorial, I’ll be working with the open source Health Information National Trends Survey (HINTS) data if you want to follow along.
What is weighting?
First, if you’re not familiar with the process, weighting cases is technique generally used to make data more representative of the population you are studying.
For example, let’s say your survey under-represented the population with a college degree. So to compensate, the second person surveyed will count as 1.2 people instead of 1.
ID     | Education | Weight
10001  | H.S.      | 1
10002  | College   | 1.2
This is oversimplified, but the underlying logic is important to understand when you start working with the data in Power BI.
Basic sums & percentages
Now onto to the HINTS data set. Let’s explore what percentage of people use the internet to access health information. This is identified as the variable Electronic_SelfHelpInfo in the data set.
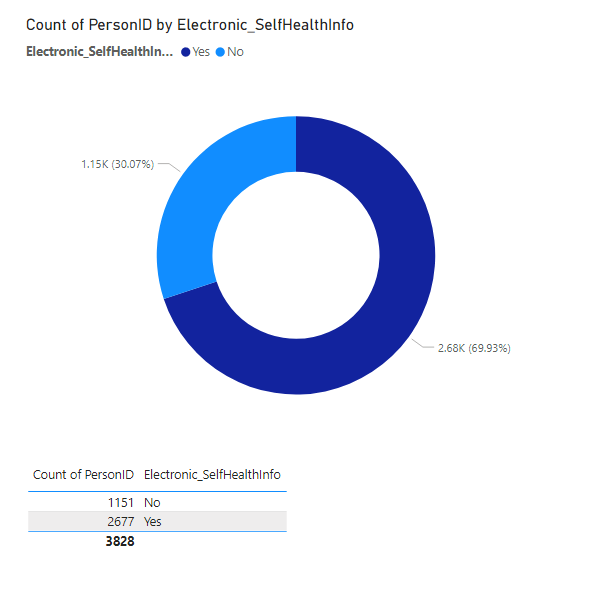
Responses are recorded as either yes or no. If this data were unweighted, to calculate the n size for each group we would simply set the value to the count of district records (in this data set, the PersonID variable). If you put the data into certain charts like a donut chart, it will automatically display the percentage of total.
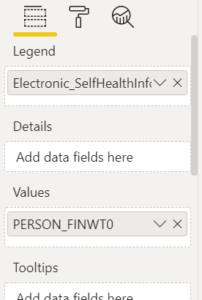
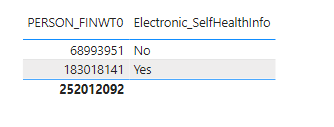
With weighted data, instead of counting the distinct records, all you need to do is change the value to the sum of the weight variable (in the HINTS data, this is stored in the Person_FinWt0 field). Notice that the percentage changes now that we’ve applied our weight.
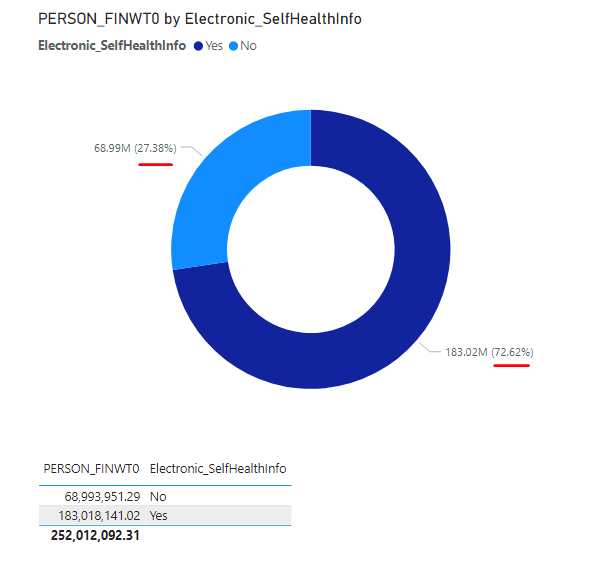
An important note: With weights, you will likely end up with a fractional n size, which will be confusing to report viewers. Always round your weight variable to the nearest whole number by changing the field’s number of decimal places to 0.


Weighted average
Things get a little trickier when we’re working with a numerical value instead of a categorical value. Imagine we wanted to know the average number of days per week that people engage in moderate exercise (recorded as the TimesModerateExercise variable in HINTS).
If we were working with unweighted data, we could simply set the value to the average of TimesModerateExercise.
But with weighted data, that wouldn’t work. Take this simple data set:
ID     | DaysExercise | Weight
10001  | 3            | 1
10002  | 2            | 2
Here, the unweighted average days would be 2.5: (3 + 2) / 2 (the number of records). But because the second case has twice the weight, the weighted average would be 2.3: (3×1 + 2×2) / 3 (the sum of the weights).
In order to accomplish this in Power BI, we’ll need to create a new custom measure using a DAX expression built on the SUMX() function.
ExcerciseDays = DIVIDE(SUMX('Table', 'Table'[TimesModerateExercise] * 'Table'[Person_FinWt0] ), SUM('Table'[Person_FinWt0]))
The SUMX() expression calculates the sum of weighted values for each record. Then we divide that value by the sum of the weights.
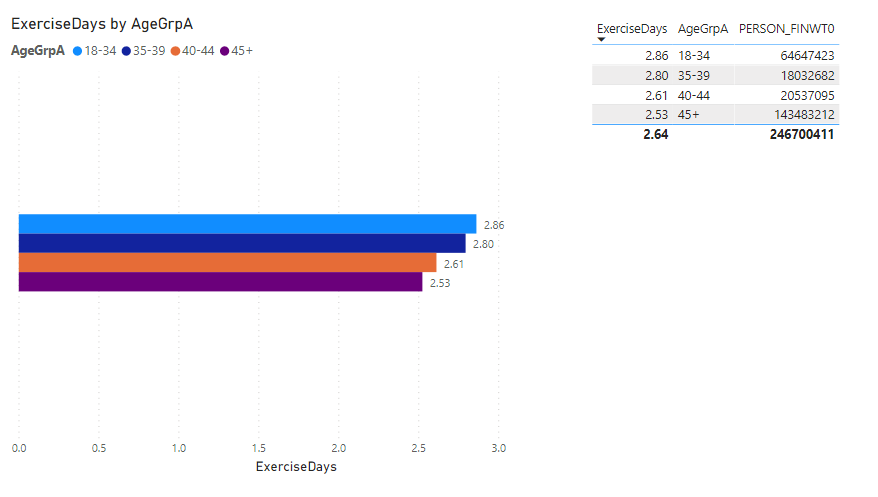
So if we set our new ExerciseDays measure as the value, we can analyze the average number by different categories. For example, here is our average exercise days metric grouped by age cohorts (set the AgeGrpA variable as the legend).
