
Python for Marketers: Measuring click through rates by search position
- What this is for: Analyzing and visualizing CTR and search position for organic search terms
- Requirements: Google Analytics data connected to Google Search Console, Python Anaconda Distribution
- Concepts covered: Simple data cleaning, Pandas dataframe, Matplotlib, search engine result position, click through rates
- Complete python file available for download
We all know search rankings matter. Users are much more likely to click on listings that show up higher in search results, so how can you do a deeper analysis of your search ranking data?
Google Analytics, through a connection with Search Console, provides a lot of great data in the Search Queries report. While there are some limitations and special considerations with this data (that you can learn more about this on the Google Analytics documentation), with this data set you can gather clicks, impressions, click through rate and average search position for the key queries that drive traffic to your site.
Google Analytics offers ways to do build queries and do basic analysis within the native website, particularly with the Performance, Comparison, Word Cloud and Pivot views.
But to do some more advanced or more custom analysis we’ll need Excel or Python. The benefit of using Python is you can write and save a script to do your custom analysis (start with downloading the .PY file) and easily repeat it again in the future. All you have to do is download the data from Google Analytics.
This data will help us:
- Measure distribution of your search rankings
- Do statistical analysis of keyword/CTR data, including mean, frequency
- Use data as a benchmark and compare performance over time
- Identify and segment important keywords
- Identify opportunities to improve SEO
- Develop strategy for improving keyword rankings
Getting Started
First, we’ll export the data from Google Analytics. This is assuming you have your Search Console linked to your Analytics account.
Go to Acquisition, Search Console, Queries. Run a report for a period of time. in this example, I used one quarter from my website with the view configured to display 1,000 results, but you can adjust as necessary. Export the data as a CSV and save the file as GA_search_queries.csv in the same directory as your Python file.
For this tutorial, I’m working in Spyder environment. First we’ll need to import the libraries we’ll be using.
import pandas as pd
import numpy as np
import matplotlib.pyplot as plt
from scipy.optimize import curve_fit
The Google Analytics data will take a little cleaning. Google Analytics adds information in the header which we won’t use, as well as summary data at the end.
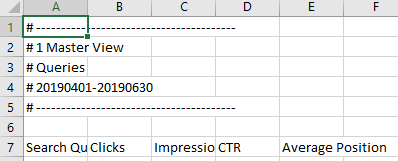
We’ll import the CSV file and then remove the first six rows. Then we’ll limit the dataframe to 1,000 rows to remove the summary data at the end of the file.
Finally, we’ll convert the numerical data from Google Analytics to a float data type.
#import CSV file and clean data
df = pd.read_csv('GA_search_queries.csv', skiprows=6) #skip the first 6 rows from GA data
df = df[:1000] #skip the last rows from GA data
df.columns = ['queries','clicks','impressions','CTR','average_position'] #rename columns
df['average_position']  = df['average_position'].astype(float) #converts conversions column into float number data type
df['CTR'] = df['CTR'].str.replace('%', '') #remove %
df['CTR'] = df['CTR'].astype(float) #convert CTR to float number format
Plotting the data
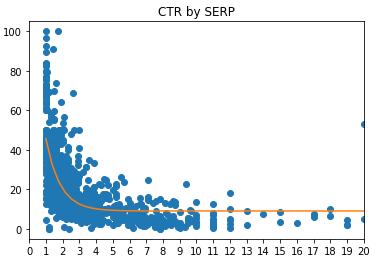
Our goal is to plot the data onto a scatter plot chart that shows the search position on the x axis and click through rate on the y axis. We’ll also plot an exponential regression curve to help visualize the data.
First, we’ll define x and y variables and our regression:
#Create variables and curve
x = np.array(df['average_position'])
y = np.array(df['CTR'])

#Create curve
def exponenial_func(x, a, b, c):
    return a*np.exp(-b*x)+c
popt, pcov = curve_fit(exponenial_func, x, y)
xx = np.linspace(1, 20)
yy = exponenial_func(xx, *popt)
Finally, we’ll plot the data. We don’t really care about keywords that are higher than rank 20 because few people actually go that far in the search results. We’ll limit our chart to 20 search positions.
#Plot results
plt.plot(x,y,'o', xx, yy)
plt.title('CTR by SERP')
plt.xlim([0,20]) #Chart results 1-20
plt.xticks(np.arange(0, 21, step=1)) #Set tick marks in intervals of 1
plt.show()
For my data, it looked something like this. Odds are, it will look similar with your own data. Click through rates generally decline as you move deeper into your search results.
Summarize the data
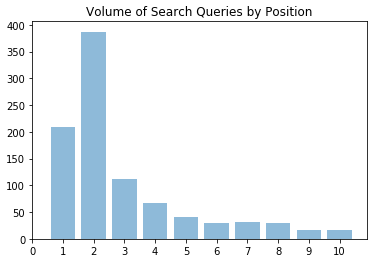
The chart is helpful to visualize the CTR of search queries to your page, but let’s say you want to know how many of your top 1,000 queries have an average ranking in the first spot, second spot, etc. Or let’s say you wanted to get the average CTR for queries at each position.
To do this, we’ll create smaller dataframes from our larger dataframe by using conditions. For example, to analyze keyword queries that average a ranking of 1, we’ll make a dataframe with a condition that the average position is equal to or greater than 1 and less than 1.5.
To analyze keyword queries that average a ranking of 2, we’ll create a condition to show only rows where the average position is equal to or greater than 1.5 and less than 2.5. And so on.
The conditions will look like this:
#Visualize mean CTR by SERP
df_1 = df[(df['average_position'] >= 1) & (df['average_position'] < 1.5)]
df_2 = df[(df['average_position'] >= 1.5) & (df['average_position'] < 2.5)]
df_3 = df[(df['average_position'] >= 2.5) & (df['average_position'] < 3.5)]
df_4 = df[(df['average_position'] >= 3.5) & (df['average_position'] < 4.5)]
df_5 = df[(df['average_position'] >= 4.5) & (df['average_position'] < 5.5)]
df_6 = df[(df['average_position'] >= 5.5) & (df['average_position'] < 6.5)]
df_7 = df[(df['average_position'] >= 6.5) & (df['average_position'] < 7.5)]
df_8 = df[(df['average_position'] >= 7.5) & (df['average_position'] < 8.5)]
df_9 = df[(df['average_position'] >= 8.5) & (df['average_position'] < 9.5)]
df_10 = df[(df['average_position'] >= 9.5) & (df['average_position'] < 10.5)]
We’ll also calculate the average CTR for each of these search positions. This is easy using the .mean() method.
We’ll also count the number of queries ranking in each position, maybe our most useful summary statistic. To do this, we’ll use the .shape method. So, .shape[0] will return the number of rows in the dataframe. We’ll put this in the column called ‘count’.
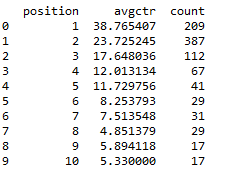
Finally, we’ll put it all together into a dataframe. So our summary dataframe will have 3 columns – search position, average CTR, and the count of queries at that position.
#Create dataframe
d = {'position': [1,2,3,4,5,6,7,8,9,10],
     'avgctr': [df_1['CTR'].mean(),
                df_2['CTR'].mean(),
                df_3['CTR'].mean(),
                df_4['CTR'].mean(),
                df_5['CTR'].mean(),
                df_6['CTR'].mean(),
                df_7['CTR'].mean(),
                df_8['CTR'].mean(),
                df_9['CTR'].mean(),
                df_10['CTR'].mean()],
     'count':[df_1.shape[0],
              df_2.shape[0],
              df_3.shape[0],
              df_4.shape[0],
              df_5.shape[0],
              df_6.shape[0],
              df_7.shape[0],
              df_8.shape[0],
              df_9.shape[0],
              df_10.shape[0]]}
df_summary = pd.DataFrame(data=d)
print(df_summary)
Plotting the summary data
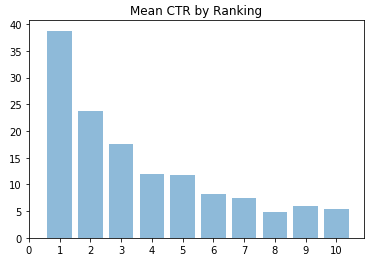
Finally, we’ll plot the summary charts
#Plot mean chart
plt.bar(df_summary['position'], df_summary['avgctr'], align='center', alpha=0.5)
plt.title('Mean CTR by Ranking')
plt.xticks(np.arange(0, 11, step=1)) #Set tick marks in intervals of 1
plt.show()

#Plot frequency chart
plt.bar(df_summary['position'], df_summary['count'], align='center', alpha=0.5)
plt.title('Volume of Search Queries by Position')
plt.xticks(np.arange(0, 11, step=1)) #Set tick marks in intervals of 1
plt.show()
The dataframe with our charts will look something like this:
Interpreting the data
This data gives us a little more insight into how queries are performing, which in this case is pretty much as expected.
But we can continue slicing the data to gain a little more insight.
For example, let’s say we wanted to find keywords to target for improvement. We could do this by finding all queries with an average ranking of 2. To do this, all you have to do is retrieve the dataframe we built earlier which contains queries with average ranking of 2.
print(df_2)
We can take this a step further and identify queries that have a higher ranking but low click through rate. Let’s say we wanted to see a list of queries that had an average ranking of 2 but click through rate below 10% (remember – the average CTR for this position was 23%). Simply build a condition of CTR less than 10.
print(df_2[(df_2['CTR'] < 10)])
Or, we could also filter to show branded queries. For this, we’ll check to see if the queries column contains a string that we define with the .contains() method. Simply replace “brand” with the branded keyword
df[df['queries'].str.contains("brand")]


