Segmenting pageviews by age and gender
Google Analytics’ Demographics report can provide a wealth of valuable data about the users of your website, including age, gender, interests and affinity categories.
One of the cool but lesser known features of Google Analytics is the ability to create pivot tables with your web data.
In this quick tutorial, we’ll make a simple pivot chart to summarize pageview data for a specific page based on age and gender categories. This tutorial will use the Google Merchandise store demo account.
To do this on your own site, you must have Demographic and Interest reports enabled. Google Analytics provides instructions on how to enable these features.
If you have not enabled these features, it will take a while for the data to populate. The data must also meet minimum thresholds for Google to display the data.
Creating a custom report
In this tutorial, we’ll create a summary chart showing pageview data by age and gender for a specific page: shop.html.
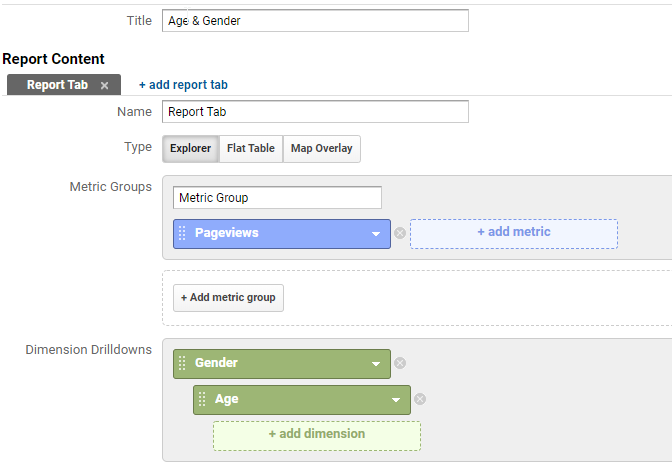
First, we’ll create a custom report by clicking on Customization -> Custom Reports.
We’ll set our Metric to Pageviews and Dimension Drilldowns to Age and Gender.

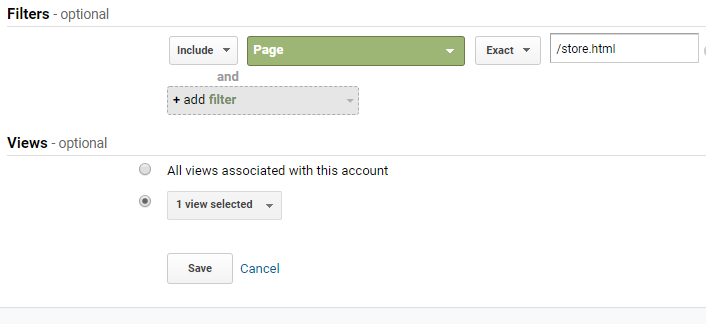
Because we’re only interested in store.html, we’ll set the filter to only include that page.

Save and view your report. For this tutorial, I set the date to 4Q of 2019 (Oct. 1, 2019 to Dec. 31, 2019).
Between the table and the chart area, select the Pivot option.

Next, change the Pivot By dropdown to Age.

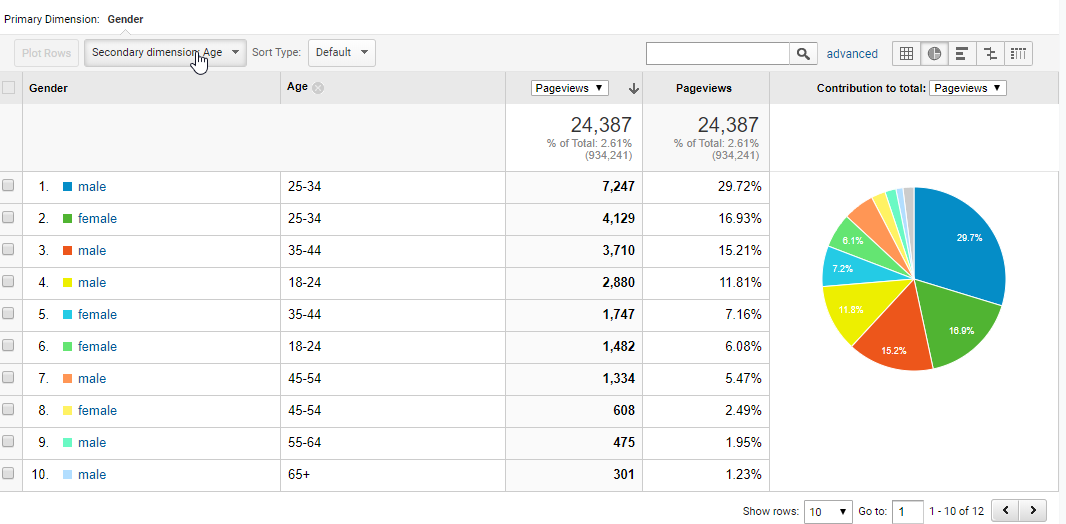
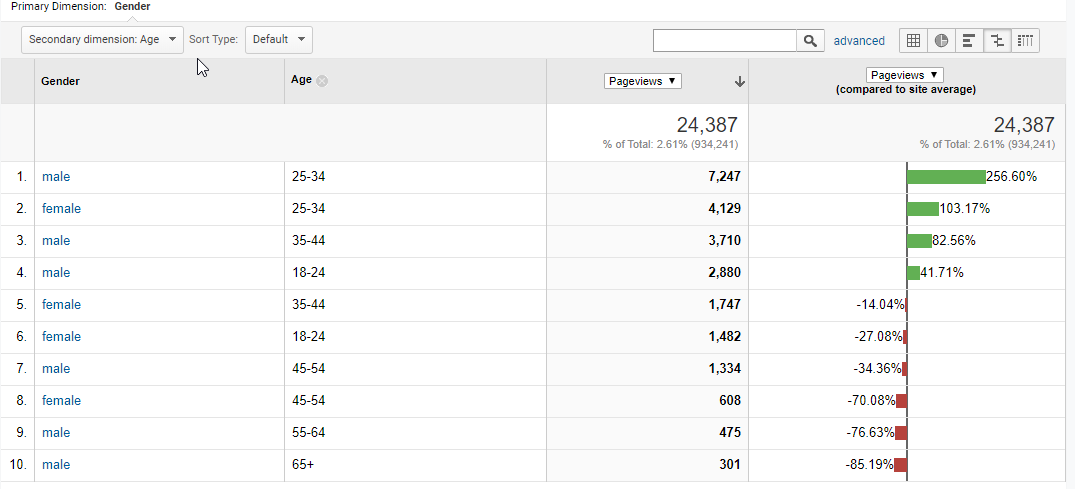
It may also help to visualize your data as a pie chart or a comparative bar graph. Simply change the view options above the chart again to one of these.


This quick analysis gives you a snapshot of the major age/gender groups visiting the page.


