Python for Marketers: Trend data from Google Analytics
- What this is for: Identifying basic data trends, Creating future goals based on trends
- Requirements: Python Anaconda distribution, Google Analytics or comparable data, Basic understanding of Pandas dataframes and Matplotlib
- Concepts covered: Basic cleaning of data, linear regression, Scatter plot
- Complete Python file available for download
One of the most basic forms of data analysis is answering the question, “What’s the trend in this data?”
In this tutorial, we’ll chart some conversion data from Google Analytics and create trend line. We’ll also use the trend line to create a simple calculation to help us come up with a target for next year.
Before we move on, an important disclaimer: If you are looking for a true forecast or prediction – especially if your data is influenced by multiple variables or has seasonal fluctuations – you will need a more sophisticated forecasting method. This is simply a quick trend of existing data with an assumption that data will follow the same trend for the next 12 months.
Setup
For this project, I am using data from a Goal in Google Analytics. I set up the view to show goal completion by month for the past 3 years and then exported as a CSV.

The file should have two columns
- Month Index, expressed as 0-35
- Goal completions
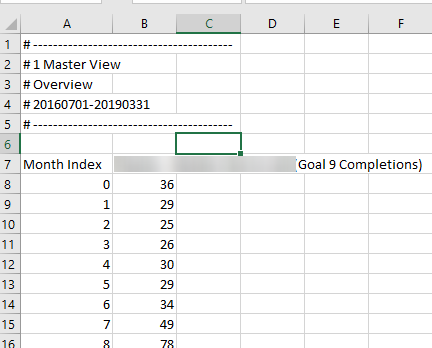
The data will take a little cleaning because Google Analytics adds a header at the beginning and a sum at the end. It will look like this in Excel.

So we’ll need to manipulate the data in Python before we start working with the data. First, let’s import our libraries:
import pandas as pd
import numpy as np
import matplotlib.pyplot as plt
from scipy import stats
Next, we’ll do some simple cleaning of the CSV from Google. We’ll get rid of the header, the sum calculation and rename the columns. Finally, because the data for the second column was interpreted as a string format, we’ll need to convert it to an integer format.
#import CSV file and clean data
df = pd.read_csv('GA_export.csv', skiprows=6) #skip the first 6 rows
df.drop(df.tail(1).index,inplace=True) #skip the last row
df.columns = ['month','conversions'] #rename columns
df['conversions'] = df['conversions'].astype(int) #converts conversions column into integer data type
To preview the dataframe, you can type
print(df.head())
Plot
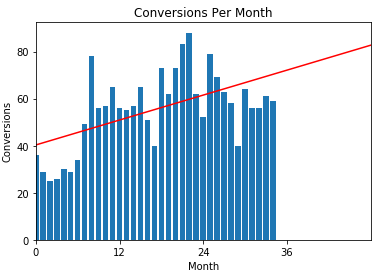
Next, we’ll plot the data. We’re going to set the X axis limit to 48 to view the trend over a a total of 48 months.
#Plot bar chart
plt.bar(df['month'], df['conversions'], align='center')
plt.xlabel('Month')
plt.ylabel('Conversions')
plt.title('Conversions Per Month')
plt.xlim(0, 48)
If you’re using the Spyder IDE, it will look something like this:

Next, we’ll add the linear regression using Scipy.
#Plot linear regression
iv = np.array(df['month'])
dv = np.array(df['conversions'])
gradient, intercept, r_value, p_value, std_err = stats.linregress(iv,dv)
mn=np.min(iv)
mx=np.max(iv)
iv1=np.linspace(mn,48,500)
dv1=gradient*iv1+intercept
plt.plot(iv1,dv1,'-r')
We’re also going to change the tick marks to show 12-month intervals because that makes more sense to look at the data annually. Don’t forget to move plt.show() to the end of the code.
#Set chart tick marks to 12 month intervals
plt.xticks(np.arange(min(iv1),max(iv1),12))
plt.show()

Calculate values
So at this point, we have our trend line, which shows a positive trend. Let’s say we want to estimate the values for the next year, assuming the trend continues.
For this, we’ll create a loop that calculates the value of the trendline at each month from month 36 to 47 and then sums all the values. We’ll plot the values on the chart and also print the sum of the values. So our code would look like this:
#Calculate and plot values for next FY months 36-47
n = 36
next_fy = 0
while n<48:
     next_fy += gradient*n+intercept
     plt.bar(n,gradient*n+intercept,color='red')
     n += 1
print('Projected FY total conversions = ',next_fy)
For our data, it returns a total of about 1,000 for next year.
Next, we’ll calculate a monthly average of the data we just calculated.
#Calcuate monthly average
fy_avg = next_fy/12
print('Projected FY average conversions per month = ',fy_avg)
For our data set, it returns an average of about 83 per month.
Finally, move the plt.show() function to the end. of the code.
That’s it! Don’t forget the .py file is available for download


